+91-98558-85133
 +1(702)760-3099
Top 10 AI Agent Development Companies in India
The global agentic AI market is projected to grow from $19.33 billion in 2026 to $205.88 billion by 2033, a 40.2% compound annual growth rate, according to research from MarketsandMarkets.
That growth isn't coming from more demos. Enterprises are moving past pilots and into real deployment, running agents across customer service, IT operations, software engineering, finance, and sales.
Buyers are also judging vendors differently now. Reasoning quality still matters, but reliability, security, and the ability to operate within defined business rules matter just as much.
That shift exposes a gap. Hundreds of companies claim "AI agents" on their homepage, but most are still shipping chatbots with a new label.
An AI agent that actually plans, decides, and executes multi-step work without hand-holding is a different engineering problem entirely. Only a handful of India-based teams have shipped that in production.
This list profiles 10 AI agent development companies in India for 2026, what each one actually specializes in, who they've built for, and what sets them apart. We evaluated each company's delivery record, technical depth, and client track record, then verified every claim against the company's own site rather than taking marketing copy at face value.
What Makes a Strong AI Agent Development Partner
Before you shortlist anyone, here's what actually separates a company that can ship a working AI agent from one that can only demo one.
Production deployments, not just prototypes.
Ask for AI agents currently running live, handling real volume, with real users. A portfolio full of proof-of-concepts and hackathon demos is a red flag.
Multi-agent and orchestration experience.
A single chatbot wrapped around an LLM is not an agent. Look for teams that have built systems where multiple agents plan, hand off tasks, and recover from failure.
Observability and governance built in.
Agents that act autonomously need monitoring, audit trails, and human-in-the-loop checkpoints, especially for regulated industries. A team that hasn't thought about this hasn't shipped agents at real scale.
Named clients and measurable outcomes.
"Improved efficiency" is not a result. Look for specific numbers, like call volume handled, hours saved, or error rate reduced.
Team depth versus team size.
A large team doesn't guarantee agent expertise; a 10-person team with a narrow, deep specialization can outperform a 1,000-person generalist shop on this specific technology.
Engagement model fit.
Fixed-scope works for a single well-defined agent. Dedicated teams work better for multi-agent systems that will keep evolving after launch.
Comparison Table for Top 10 AI Agent Development Companies in India
| Company | Founded | Team Size | Key AI Specialization | Client Rating |
|---|---|---|---|---|
| Trigma | 2008 | 50-249 | Multi-Agent AI Systems, Agentic AI, Custom AI Solutions | 5.0 (137 reviews) |
| Trigent Software | 1995 | 1,000-9,999 | AI Development, GCC Services, BI & Big Data | 4.8 (57 reviews) |
| WPWeb Infotech | 2016 | 250-999 | Custom AI Agents, Multi-Agent Systems | 5.0 (85 reviews) |
| Quytech | 2010 | 250-999 | Generative AI, AI Agents, Mobile AI | 4.8 (148 reviews) |
| Intuz | 2008 | 50-249 | AI Agents, AI Development, Automation | 4.8 (52 reviews) |
| Krazimo | 2023 | 10-49 | Multi-Agent Systems, RAG, MLOps | 5.0 (12 reviews) |
| Mallow Technologies | 2010 | 250-999 | AI Development, AI Agents, Salesforce AI | 5.0 (21 reviews) |
| SparxIT | 2007 | 250-999 | AI Agents, AI Consulting | 4.8 (79 reviews) |
| Ahex Technologies | 2009 | 50-249 | AI Development, ERP + AI Integration | 4.9 (52 reviews) |
| Reckonsys | 2015 | 50-249 | AI Agents, AI Development, Generative AI | 3+ stars (32 reviews) |
The List of Top 10 AI Agent Development Companies in India
1. Trigma
Trigma designs and builds intelligent systems for enterprises and growth-stage businesses. Founded in 2008, the team works from its headquarters in Sahibzada Ajit Singh Nagar (Mohali), India, with a second location in Las Vegas, Nevada.
Its work spans agentic AI development, generative AI, custom software, and mobile, web, and cloud development, delivered under one roof.
One live example is a voice AI platform built for a US healthcare revenue cycle company. It now handles 10x the outbound claims-follow-up call volume at 40-60% lower labor cost, fully HIPAA-compliant and auditable.
Expertise:
- AI agents, multi-agent systems, and agentic process automation, including AI voice agents for healthcare revenue cycle use cases like claims follow-up and patient outreach
- Generative AI development and AI consulting
- AI integrated into existing platforms, including LIMS, ERP, CRM, analytics, and predictive maintenance
- Full-stack custom software, mobile app, and cloud, IoT, and AR/VR development
Expertise:
- 750+ projects delivered across 20+ industries since 2008
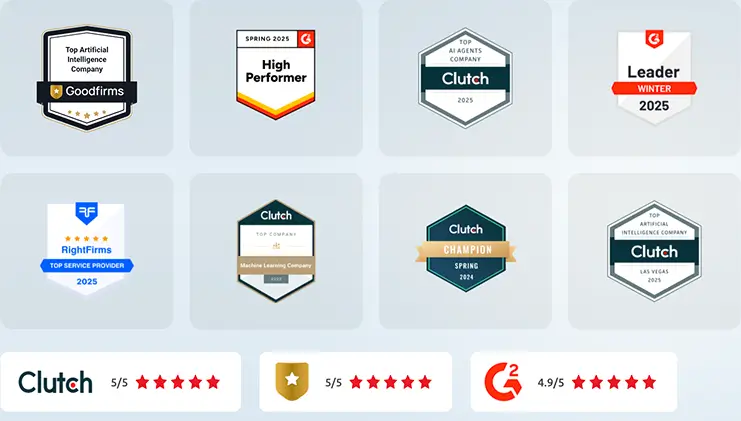
- Rated 5.0 and 4.9 across 260+ combined reviews on independent platforms
- Built for buyers who want AI, software, mobile, and cloud delivered by one full-stack partner instead of juggling multiple specialists
- Deep experience in healthcare, education, finance, and real estate, alongside midmarket and enterprise teams across other industries
- A track record of on-time delivery and consistent communication
Industries served. Healthcare, education, finance, and real estate, spanning 20+ industries overall.
With Trigma, you're not evaluating a demo. You're evaluating a team with agents already running in production, at scale, for paying enterprise clients.
Looking for a Technology Partner, Not Just a Vendor?
Whether it's a mobile app, an enterprise system, or an AI agent, Trigma's engineers build around how your business actually runs.
2. Trigent Software
Trigent is a technology services company founded in 1995, with development centers spanning the US and Bengaluru, India.
Its recent AI push centers on ArkOS, an AI workbench built for validating AI decisions and testing decision logic before agents get deployed into production. That's a genuinely different angle from most companies on this list, which focus on building agents rather than validating them.
Expertise:
- AI decision validation and testing, through its ArkOS workbench
- AI development, alongside Global Capability Centre (GCC) enablement services
- BI and big data consulting and systems integration
- Cloud, infrastructure, and automation services
Industries served. Healthcare,Financial services, healthcare, manufacturing, retail, logistics, education, legal tech, and insurance.
3. WPWeb Infotech
WPWeb Infotech has spent 10+ years building web, mobile, and now AI agent solutions, with a full-stack agent practice spanning consulting, custom development, multi-agent orchestration, and AI governance.
Its published case studies show real production numbers. An internal AI QA agent cut manual test authoring effort by 93%, and an AI business analyst agent generates client-ready scope-of-work documents 82% faster.
Expertise:
- Custom AI agent development and multi-agent systems, including orchestration and supervision
- AI agent integration into existing CRM, ERP, and business systems
- LLM fine-tuning and AI optimization
- AI governance, guardrails, and monitoring, including HITL validation and compliance tracking
Industries served. Retail, healthcare, real estate, education, social networking, and sports.
4. Quytech
Quytech has been building AI and mobile products since 2010, with 1,000+ projects delivered and 500+ clients spanning startups to enterprises like Honda and Deloitte.
Its AI agent practice sits inside a broader generative AI and machine learning team. That gives clients access to AI/ML engineers alongside dedicated mobile and web developers under one roof.
Expertise:
- Generative AI development and large language model integration
- AI agent development, for customer-facing and internal automation use cases
- Machine learning and computer vision
- Mobile, web, and blockchain development
Industries served. Healthcare, fintech, education, retail, logistics, and travel.
5. Intuz
Intuz engineers intelligent, scalable systems with an AI agent and automation practice built for business process work, from customer-facing agents to internal workflow automation.
The company pairs AI development with a strong IoT and cloud engineering bench. That's useful for clients whose agents need to interact with connected devices or existing enterprise infrastructure.
Expertise:
- AI agent development for business automation, the largest share of Intuz's project mix
- Custom AI development and consulting
- IoT integration and cloud solutions, as an AWS Consulting Partner
- Custom software and cross-platform application development
Industries served. Healthcare, automotive, manufacturing, ecommerce, logistics, and smart cities.
6. Krazimo
Krazimo is the smallest and youngest company on this list, and that's the point. Founded in 2023 by two former Google engineers who ran production systems inside Google Workspace, Krazimo deliberately caps its active engagements so the senior engineers who scope a project are the same people who write the code.
Its focus stays narrow, spanning AI agents and multi-agent systems, RAG over private company data, and MLOps. It's built with what the company calls restraint and rigor rather than chasing every AI trend.
Expertise:
- AI agents and multi-agent systems, built for production reliability over flashy demos
- Retrieval-augmented generation (RAG) over private company knowledge
- Machine learning deployment and MLOps
- Custom AI software, including internal tools and operations systems
Industries served. Legal tech, education, healthcare, and fintech.
7. Mallow Technologies
Mallow Technologies has specialized in AI-driven custom web and mobile development since 2010, with 16+ years of experience and a growing focus on Salesforce-integrated AI.
Its certifications across Salesforce's Agentforce and AI-Associate tracks put it in a smaller group of India-based companies that can build agents directly inside a client's existing Salesforce environment, rather than as a separate bolt-on system.
Expertise:
- AI agent development and AI-driven automation
- Salesforce AI, including Agentforce-specialist certified implementation
- Custom web and mobile application development
- DevOps and low-code/no-code development
Industries served. Banking and financial services, logistics, and general enterprise.
8. SparxIT
SparxIT has been in business since 2007, growing into a digital transformation partner with 15,000+ delivered projects and offices across the US, UK, UAE, and India.
Its AI agent and AI consulting practice sits within a broader engineering team spanning Java, .NET, and Node. That gives clients a single vendor for both the AI layer and the surrounding application infrastructure.
Expertise:
- AI agent development and AI consulting
- Custom software development, backed by Java, .NET, and Node engineering depth
- Blockchain, AI/ML, and AR/VR integration
- Digital transformation and product engineering
9. Ahex Technologies
Ahex Technologies has been delivering software since 2009, with a specific niche in combining AI development with Odoo ERP implementation, a pairing not many companies on this list offer.
That combination matters for clients who want AI agents that plug directly into existing ERP workflows, rather than operating as a separate system that needs custom integration work.
Expertise:
- AI agent and AI development, including diagnostics and workflow automation use cases in healthcare
- Odoo ERP implementation and customization, paired with AI integration
- Mobile app development across iOS, Android, Flutter, and React Native
- DevOps and cloud infrastructure consulting
Industries served. Manufacturing, healthcare, fintech, education, logistics, and retail.
10. Reckonsys
Reckonsys is a Bengaluru-founded software company that has built out a dedicated AI solutions practice alongside its core UI/UX design and platform development work.
Its positioning leans toward end-to-end product development, where the AI agent isn't a bolt-on feature but part of a platform built from the ground up.
Expertise:
- AI agent development and generative AI integration
- End-to-end platform development, including UI/UX design
- AI consulting and solution architecture
- Custom software development for startups and enterprises
Industries served. Healthcare, fintech, and general enterprise software.
Why Trigma Stands Out
Agents that are already in production, not on a roadmap
Most companies on this list can talk about AI agent architecture. Fewer can point to a named client seeing a 10x increase in handled call volume because of an agent Trigma built and shipped.
That gap, between describing agentic AI and having it running today, is the single biggest differentiator on this entire list.
The Global Capability Centre advantage
Through its GCC model, Trigma gives clients dedicated engineering teams at a fraction of the cost of building in-house, while keeping the client in full control of priorities and delivery.
That's a different value proposition than hiring an agency for a fixed-scope project. It's closer to building your own AI team without the hiring overhead.
Observability isn't an afterthought
A lot of companies building AI agents in 2026 are still treating monitoring and governance as a phase-two problem. Trigma builds AI agent observability into the delivery from the start.
That matters most for regulated industries like healthcare, where an agent making an unaudited decision isn't just a bug. It's a compliance risk.
A track record that spans more than one industry
From healthcare voice AI to enterprise workforce intelligence platforms, Trigma's agent work isn't concentrated in a single vertical. That range means the team has already solved adjacent problems to whatever a new client is facing.
Key Questions to Ask Before You Hire an AI Agent Developer
Can you show me an AI agent running in production today, not a demo?
This is the single most important question on this list. A team that can only point to internal demos or hackathon projects hasn't yet solved the harder problem of keeping an agent reliable with real users and messy data.
How do you handle the agent making a wrong decision?
Every agent will eventually make a bad call. Ask specifically about human-in-the-loop checkpoints, rollback mechanisms, and how errors get caught before they cause damage.
How do you handle the agent making a wrong decision?
Every agent will eventually make a bad call. Ask specifically about human-in-the-loop checkpoints, rollback mechanisms, and how errors get caught before they cause damage.
How do you handle data security for agents that touch sensitive systems?
An agent that reads from or writes to your CRM, ERP, or patient records needs the same security rigor as any other system with that access. Ask about encryption, access controls, and compliance certifications relevant to your industry.
What happens after launch?
Agents need retraining, monitoring, and occasional rework as business processes change. A team that treats launch as the finish line isn't set up for the ongoing relationship an agent actually needs.
Is this single-agent or multi-agent, and does that match my actual problem?
Not every use case needs a multi-agent system. A team that pushes multi-agent complexity on a problem a single well-scoped agent could solve is optimizing for their own build, not your outcome.
FAQs
What are the top AI agent development companies in India in 2026?
Trigma, Trigent Software, WPWeb Infotech, Quytech, Intuz, Krazimo, Mallow Technologies, SparxIT, Ahex Technologies, and Reckonsys are among the leading AI agent development companies in India, each with verified client ratings on independent review platforms.
What's the difference between an AI agent and a chatbot?
A chatbot follows a conversational script and responds to what a user types. An AI agent has contextual memory, can use external tools, and can plan and execute multi-step tasks autonomously, without a human directing each individual step.
How much does AI agent development cost in India?
Costs vary widely by scope and provider. Smaller, single-agent projects can start in the low tens of thousands of dollars, while multi-agent enterprise systems with full governance and integration work often run into six figures. Get a scoped proposal rather than relying on published hourly rates alone.
How do I evaluate whether an AI agent developer is actually experienced, versus just claiming AI expertise?
Ask for AI agents currently running in production, not prototypes, along with specific, named outcomes. Combine that with checking their rating and review volume on independent, verified platforms, and asking pointed questions about how they handle errors, security, and post-launch support.
Why does India lead in AI agent development talent?
India combines a large, technically deep engineering talent pool with cost-efficient delivery models, which has made it a hub for both boutique AI-specialist firms and large-scale GCC enablers. Many companies on this list serve US and European enterprise clients directly from India-based or hybrid delivery teams.
What industries benefit most from AI agent development?
Healthcare, financial services, ecommerce, and logistics see some of the highest-impact AI agent deployments, since these industries combine high transaction volume with repetitive, rules-heavy workflows that agents can meaningfully automate. That said, any business with complex, multi-step operational processes is a candidate.
Summing Up
The AI agent development market in India spans everything from three-decade-old GCC enablers to two-year-old boutique shops founded by ex-Google engineers. The right fit depends entirely on your project's scale and complexity.
What separates the companies on this list from the rest of the market is a track record of agents that actually work once real users and real data show up, not just agents that work in a demo.
Trigma's combination of shipped, measurable production results and a GCC delivery model built for enterprise scale is what puts it at the top of this list.
Trigma's combination of shipped, measurable production results and a GCC delivery model built for enterprise scale is what puts it at the top of this list.